copy

CASE STUDY

SpareParts Management System

Enterprise dashboard for manufacturing operations — complex data visualization, real-time monitoring, and a mobile experience that doesn't compromise.

Complex Dashboards Fully Responsive Data-Heavy Applications B2B SaaS

PROJECT TYPE

Personal Project

PLATFORM

Web Dashboard

INDUSTRY

Manufacturing ERP

COMPONENTS

175+ Reusable

SpareParts Management System Dashboard

A complete enterprise resource planning dashboard for spare parts manufacturing and inventory management — designed as a personal project to demonstrate my ability to handle complex, data-heavy B2B SaaS interfaces.

The system covers every aspect of a manufacturing operation: inventory tracking, production orders, supplier relationships, warehouse logistics, quality control, and real-time alerts.

The core challenge: Manufacturing dashboards require displaying massive amounts of data in a way that's both comprehensive for desktop power users and genuinely usable on mobile devices for on-the-floor managers.
WHAT I BRING

What I bring to complex dashboard projects

Data Visualization

Smart visual hierarchies that make complex datasets instantly readable — KPI cards, trend indicators, real-time alerts, and contextual charts that tell the right story.

Adaptive Mobile Design

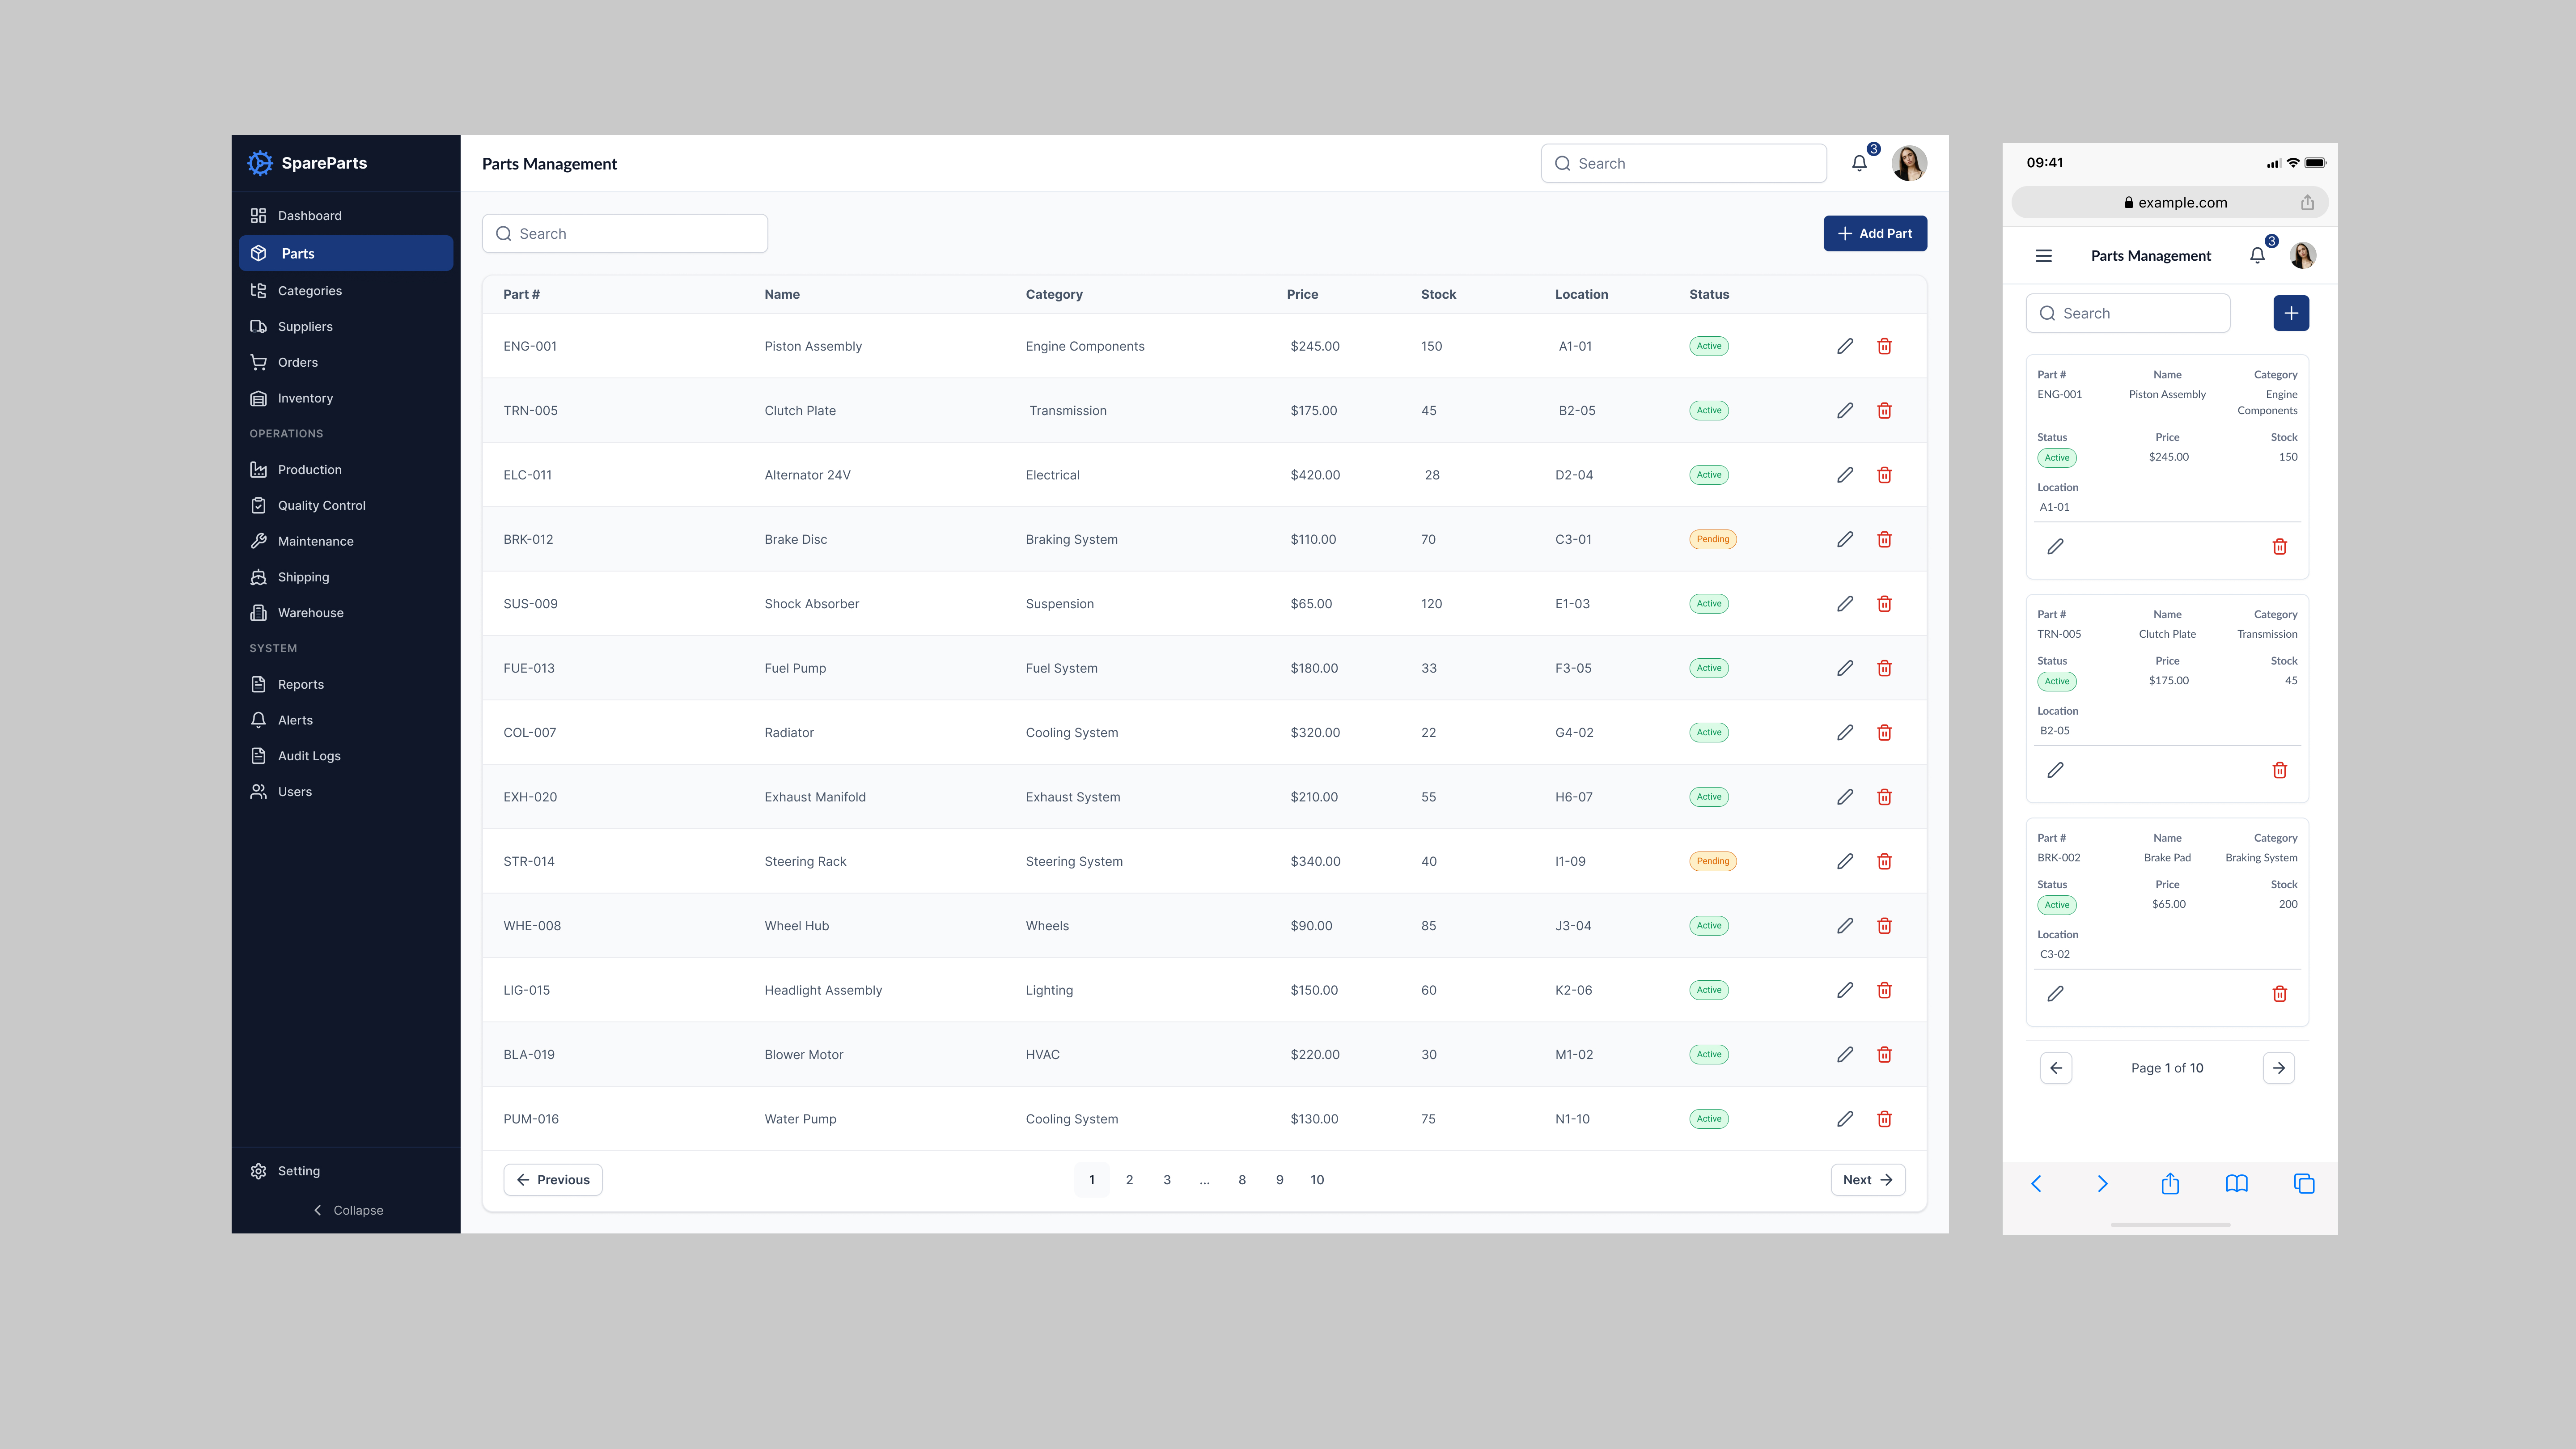
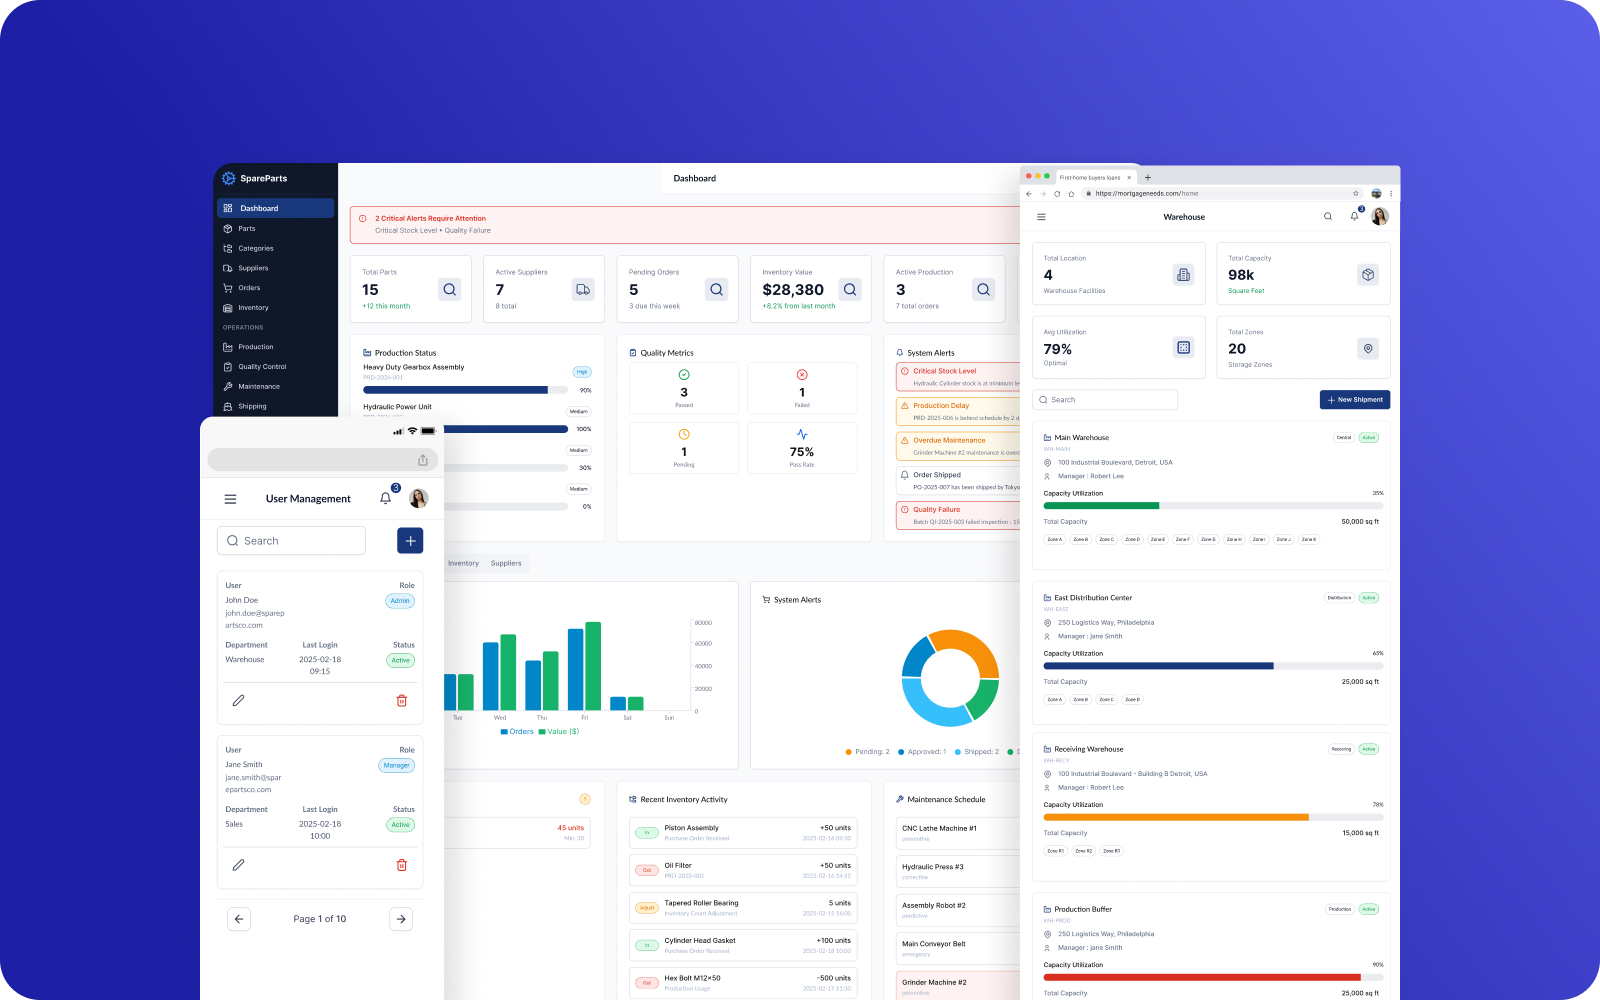
Complex tables become scannable cards on mobile. Every column becomes a labelled row, every action becomes a thumb-reachable button. No horizontal scrolling, full functionality.

Design System Integration

Every dashboard is built on a comprehensive design system — reusable components, consistent spacing, documented patterns, and developer-friendly handoff.

Information Architecture

Organizing complex information so users find what they need in two clicks, not ten. Logical navigation, smart filtering, contextual actions, role-based views.

Real-Time Monitoring

Critical alerts designed to grab attention without overwhelming — priority-based systems, color-coded status, actionable notifications, and system health monitoring.

Complex Data Tables

Making large datasets scannable through smart formatting, sorting, and progressive disclosure. Multi-column tables, inline editing, advanced filtering, bulk operations.

MY APPROACH

Why mobile-first matters in enterprise dashboards

Most designers shrink desktop layouts for mobile. I rebuild them — complex tables become scannable cards, every column a labelled row, every action thumb-reachable.

The result is a mobile experience your users will actually use, instead of waiting until they're back at a computer. No horizontal scrolling, no hidden functionality, no compromises.

8 Dashboard Modules
50+ Unique Screens
100% Mobile Responsive
175+ Components Used

SCREENS

Dashboard Modules & Screens

MAIN DASHBOARD & ANALYTICS

Main Dashboard

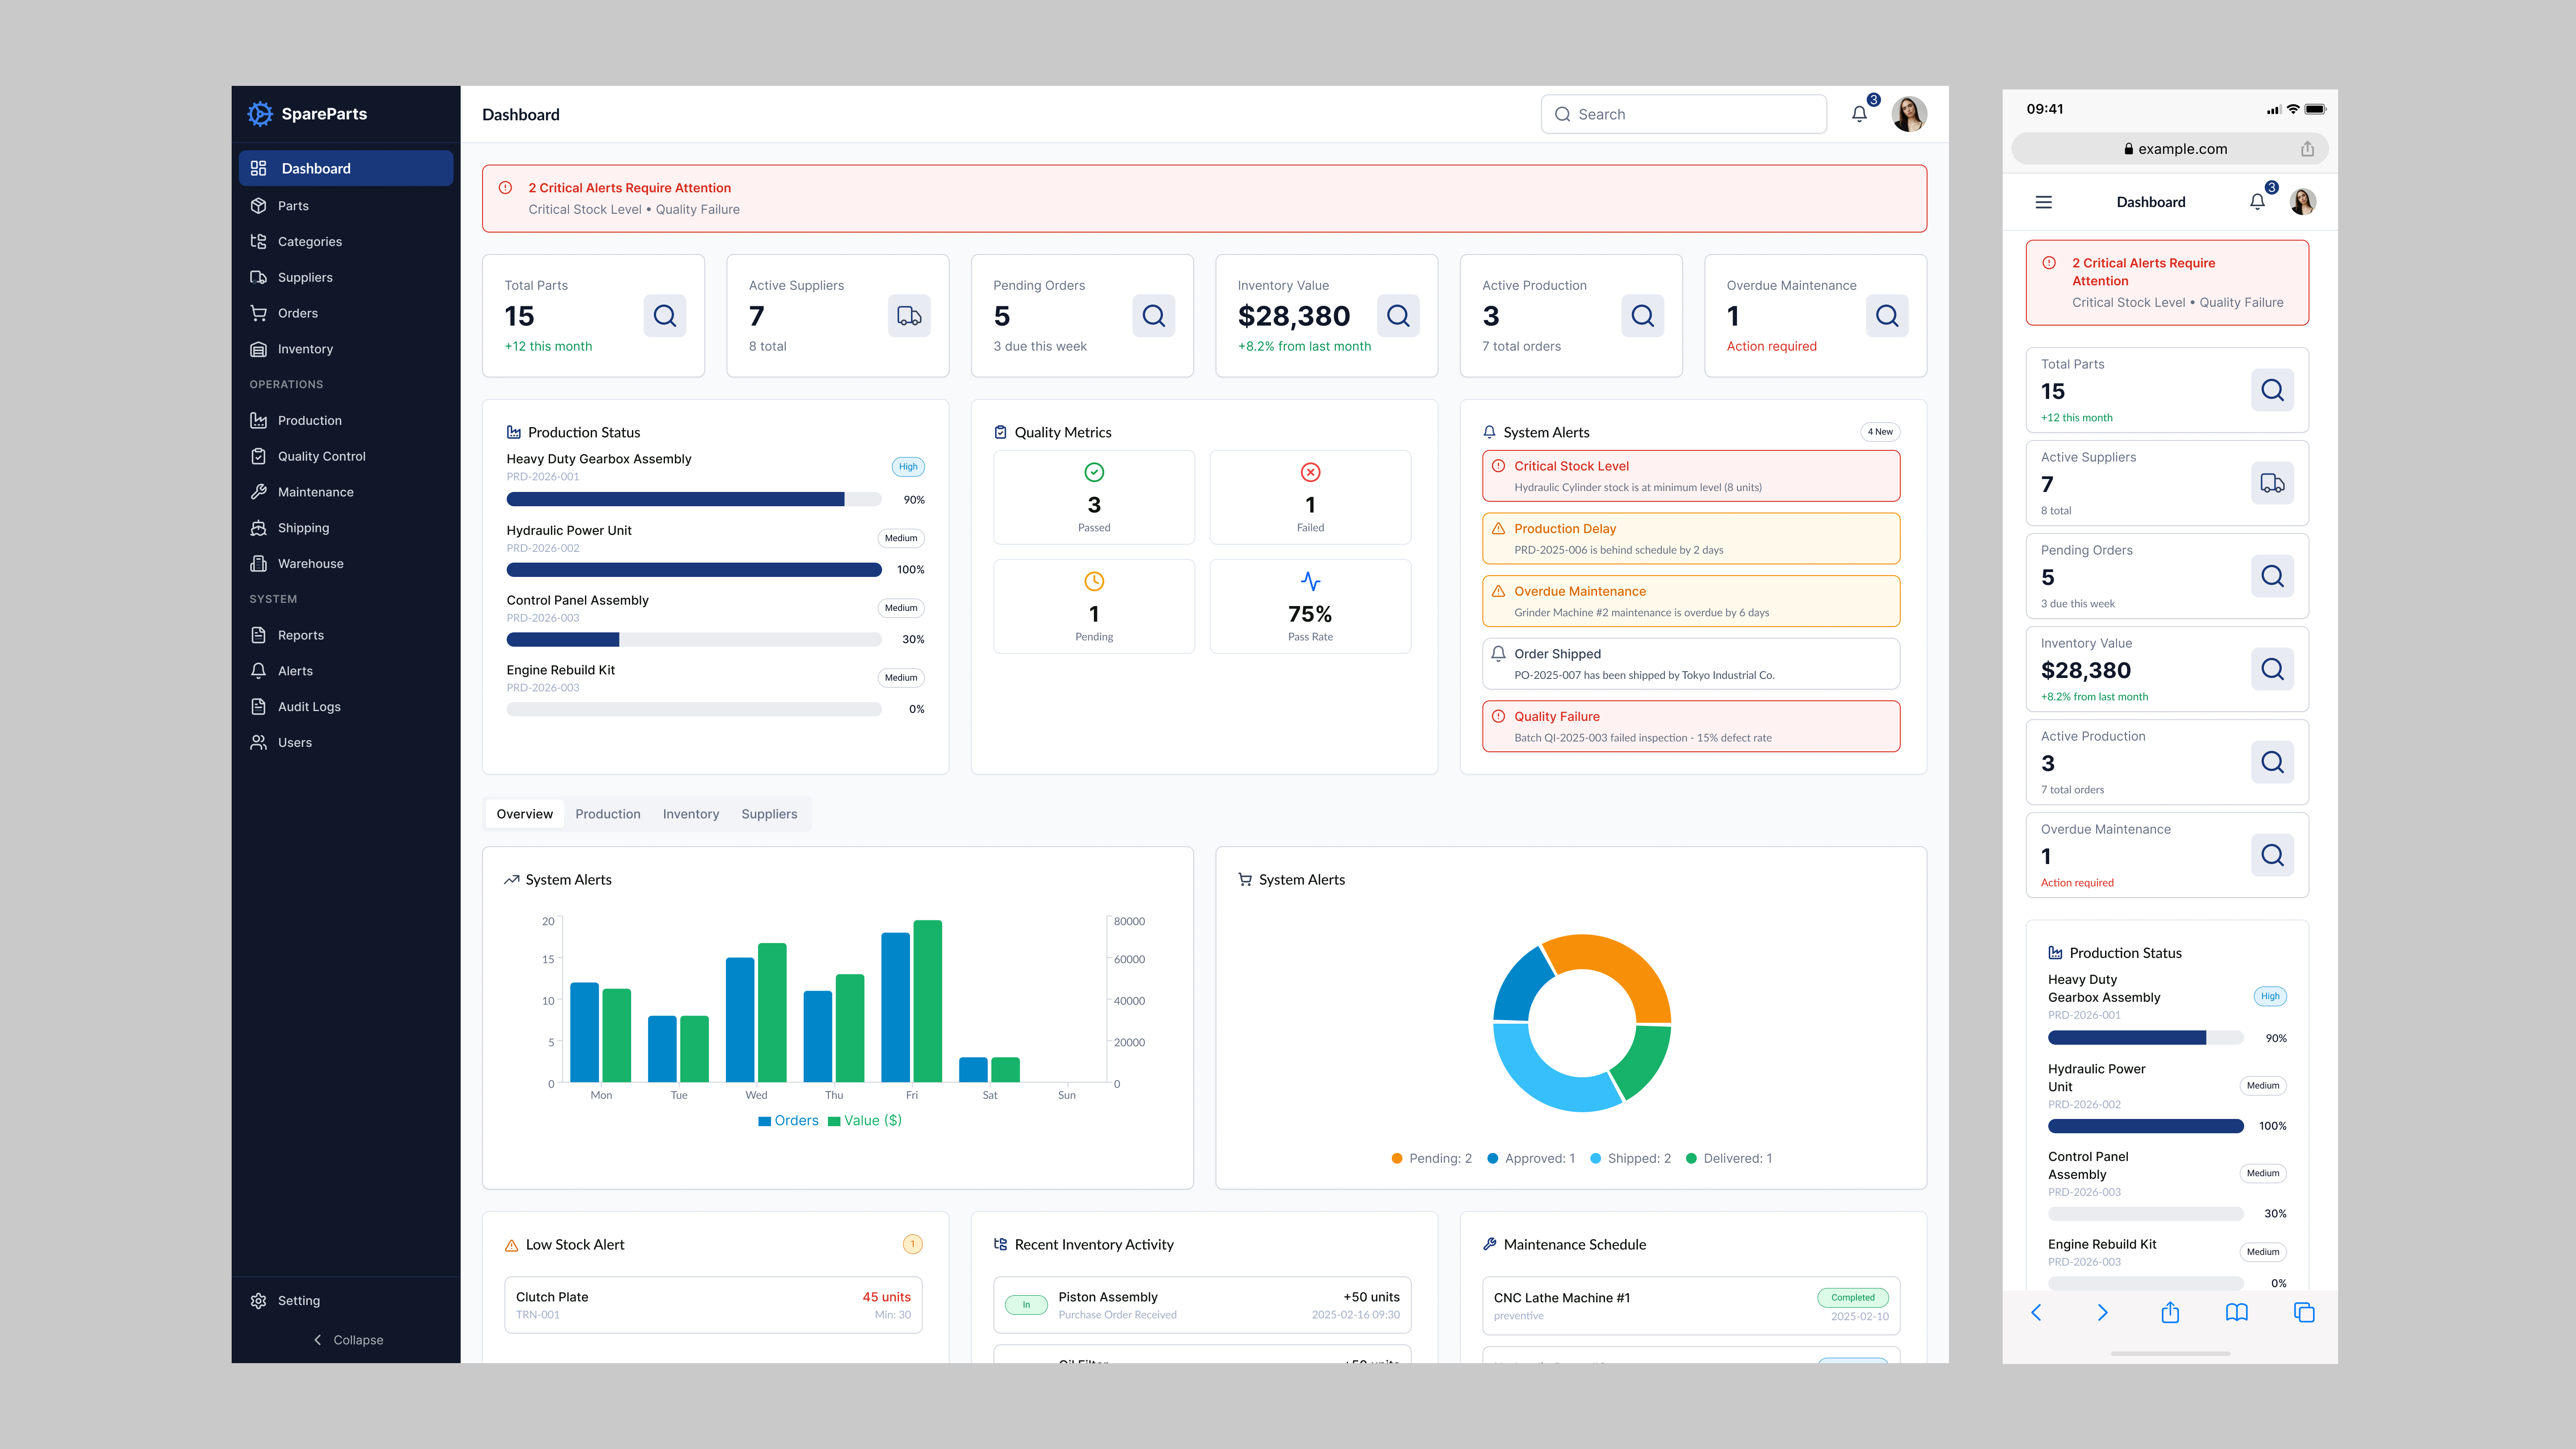
Main Dashboard

Executive Dashboard with KPIs, real-time alerts, production status, quality metrics, and system health monitoring.

Reports & Analytics

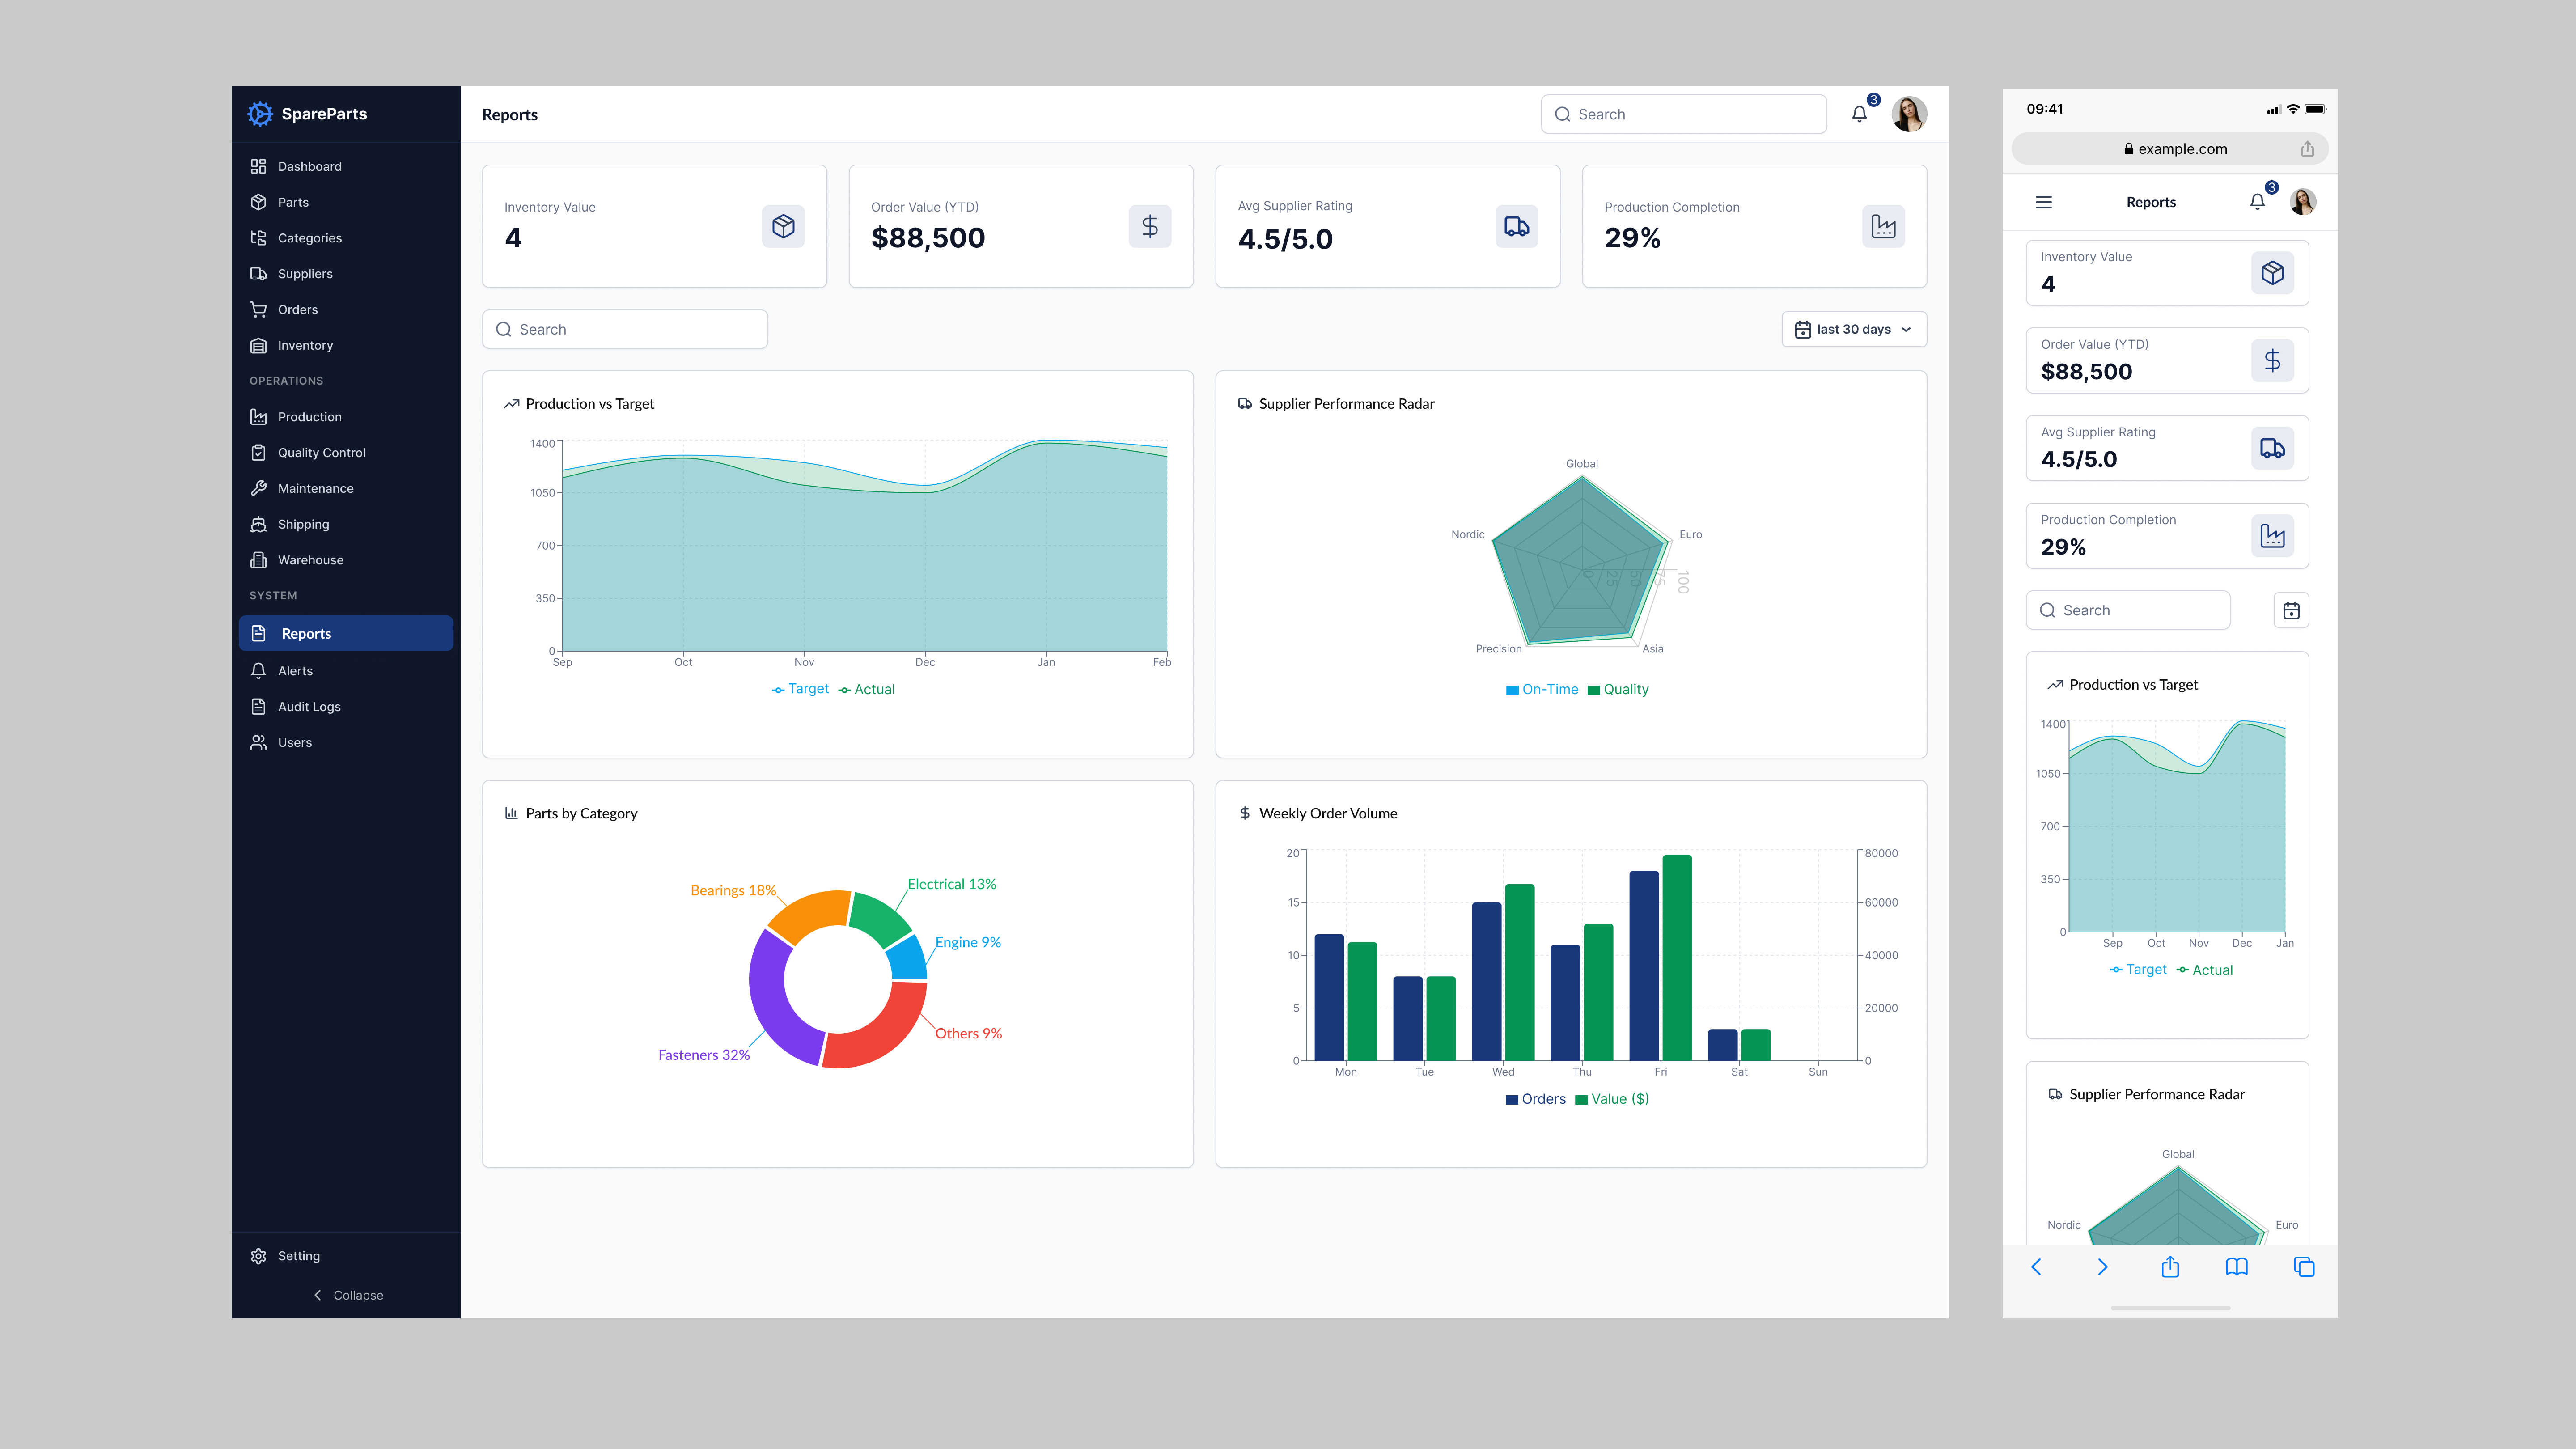
Reports & Analytics

Interactive charts: production trends, supplier performance radar, parts distribution, and weekly order volume analysis.

INVENTORY & PARTS

Parts Management

Parts Management

Comprehensive parts inventory with 8-column table — Part #, Name, Category, Price, Stock, Warehouse, Status — inline edit and delete with smart filtering.

OPERATIONS & WAREHOUSE

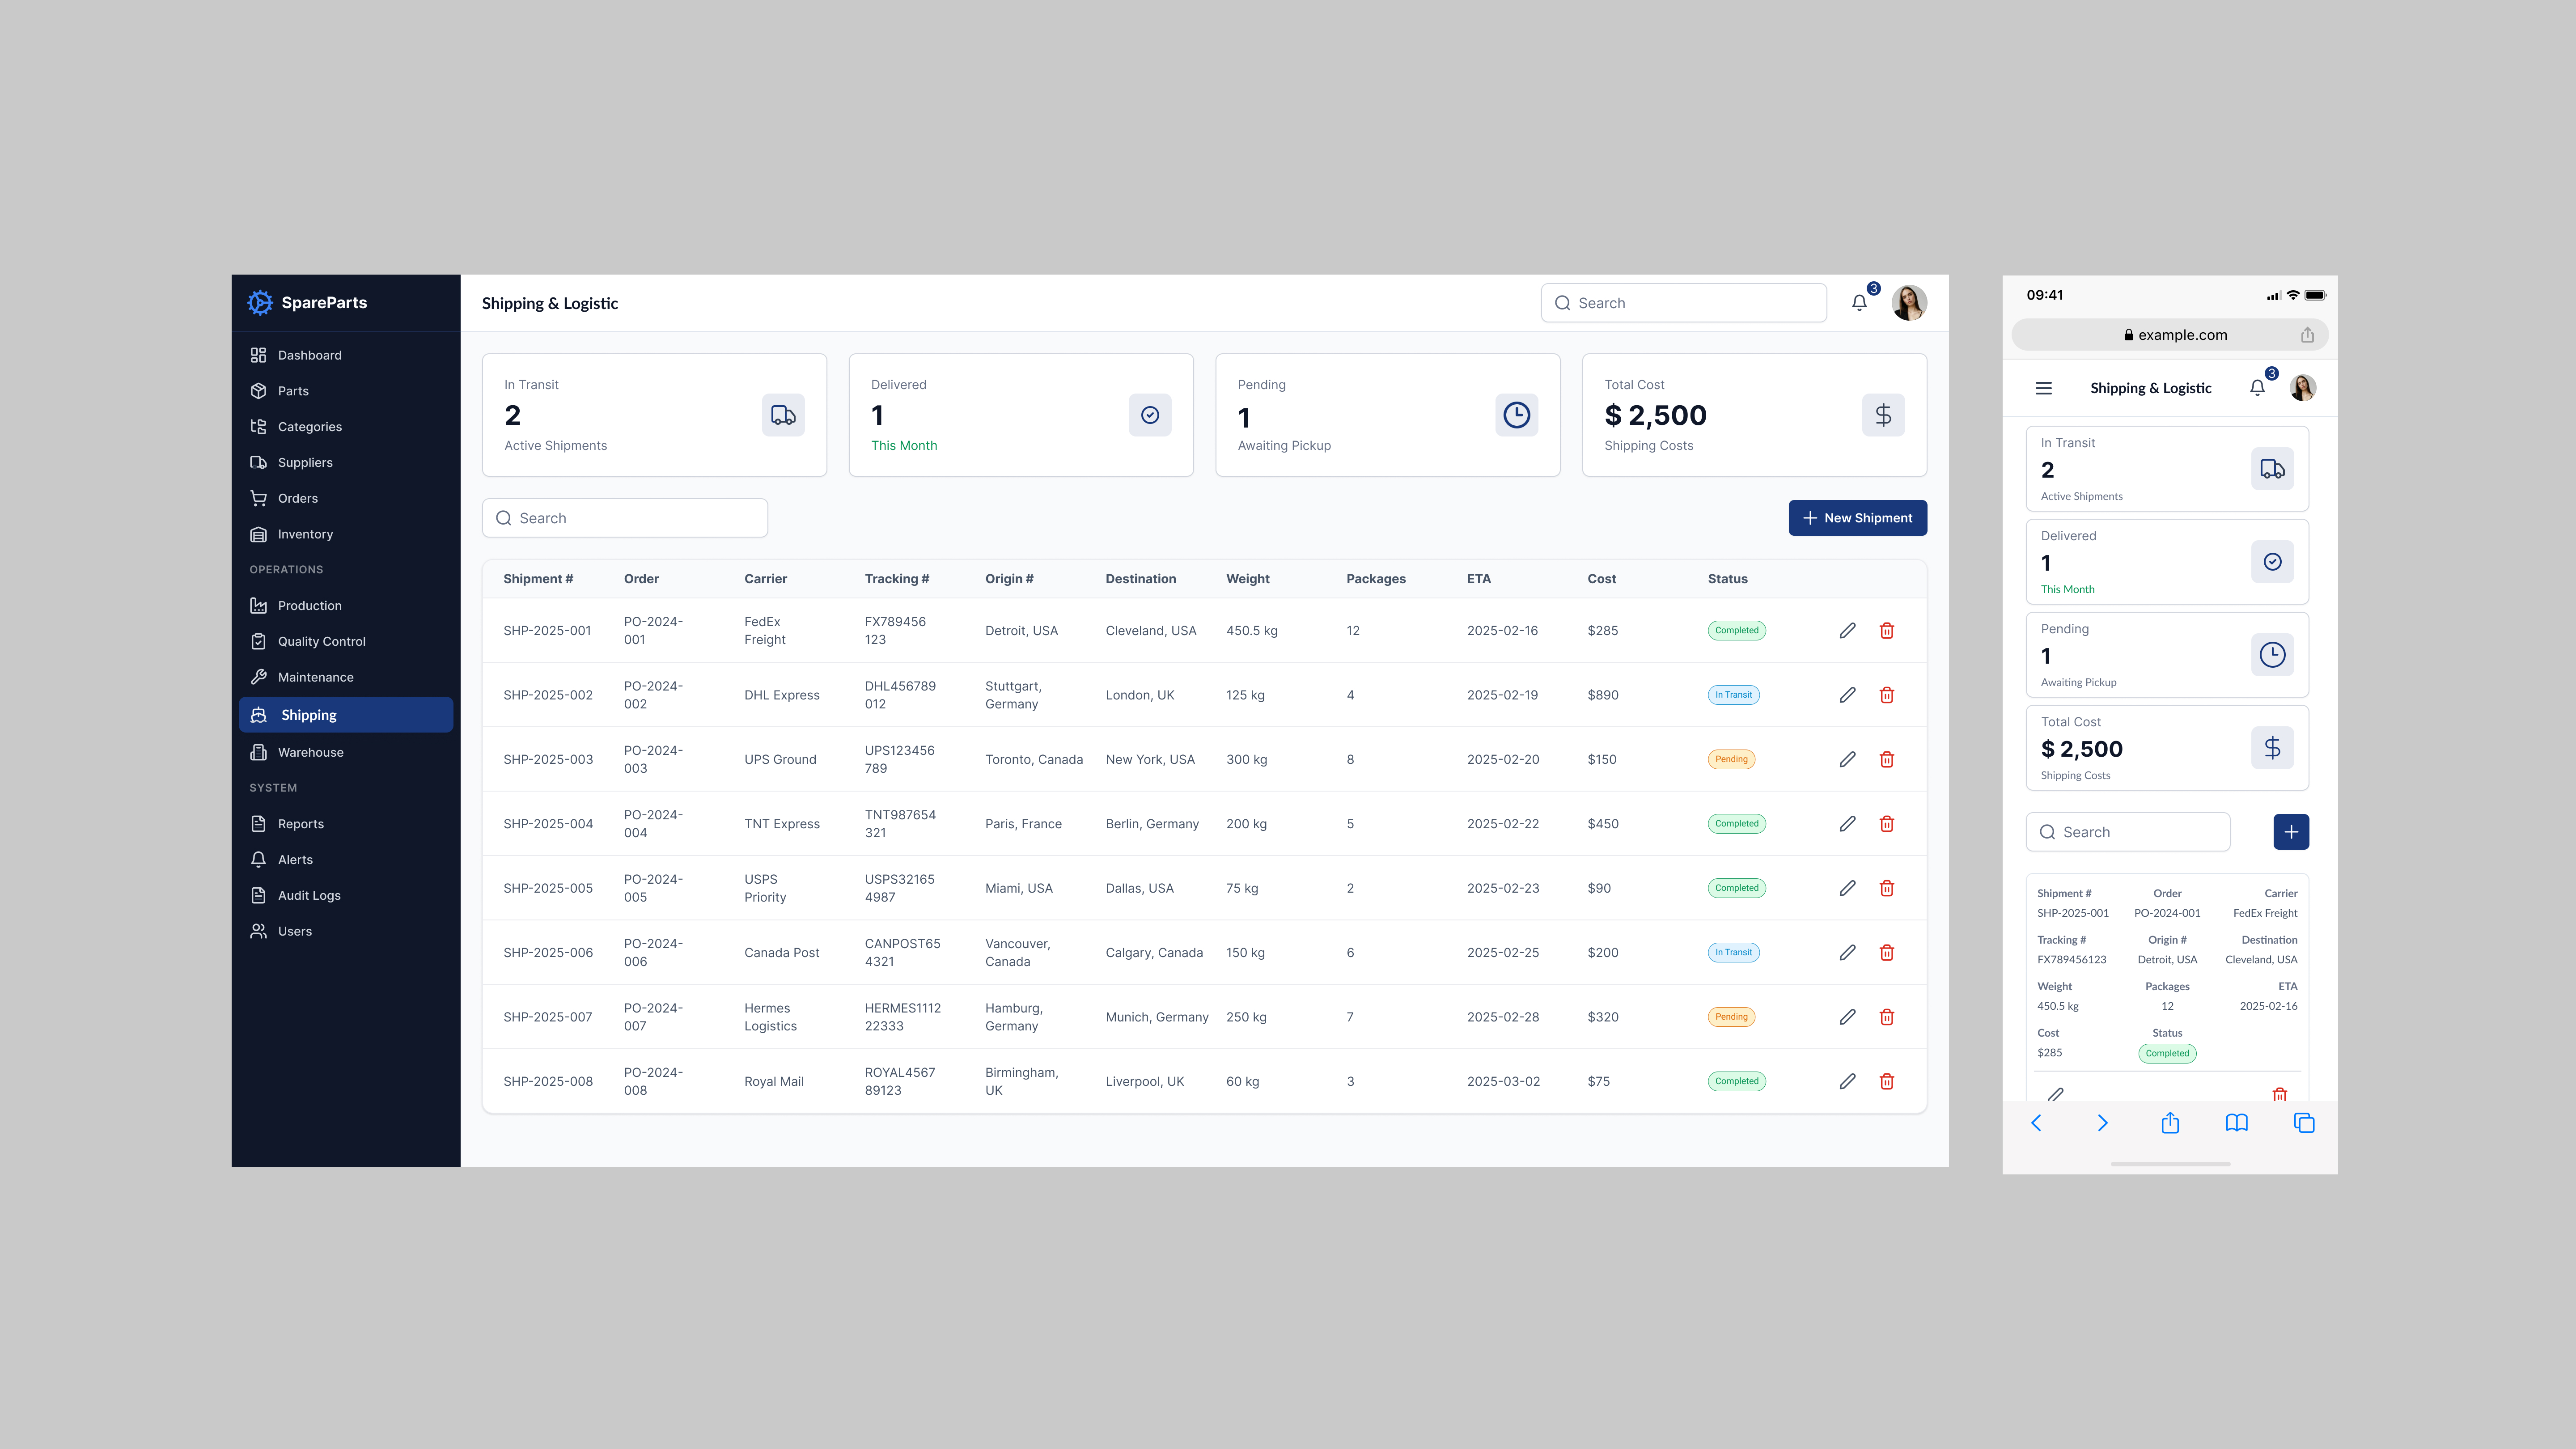
Purchase Orders

Purchase Orders

Supplier order tracking with amounts, delivery dates, status workflows, and inline editing.

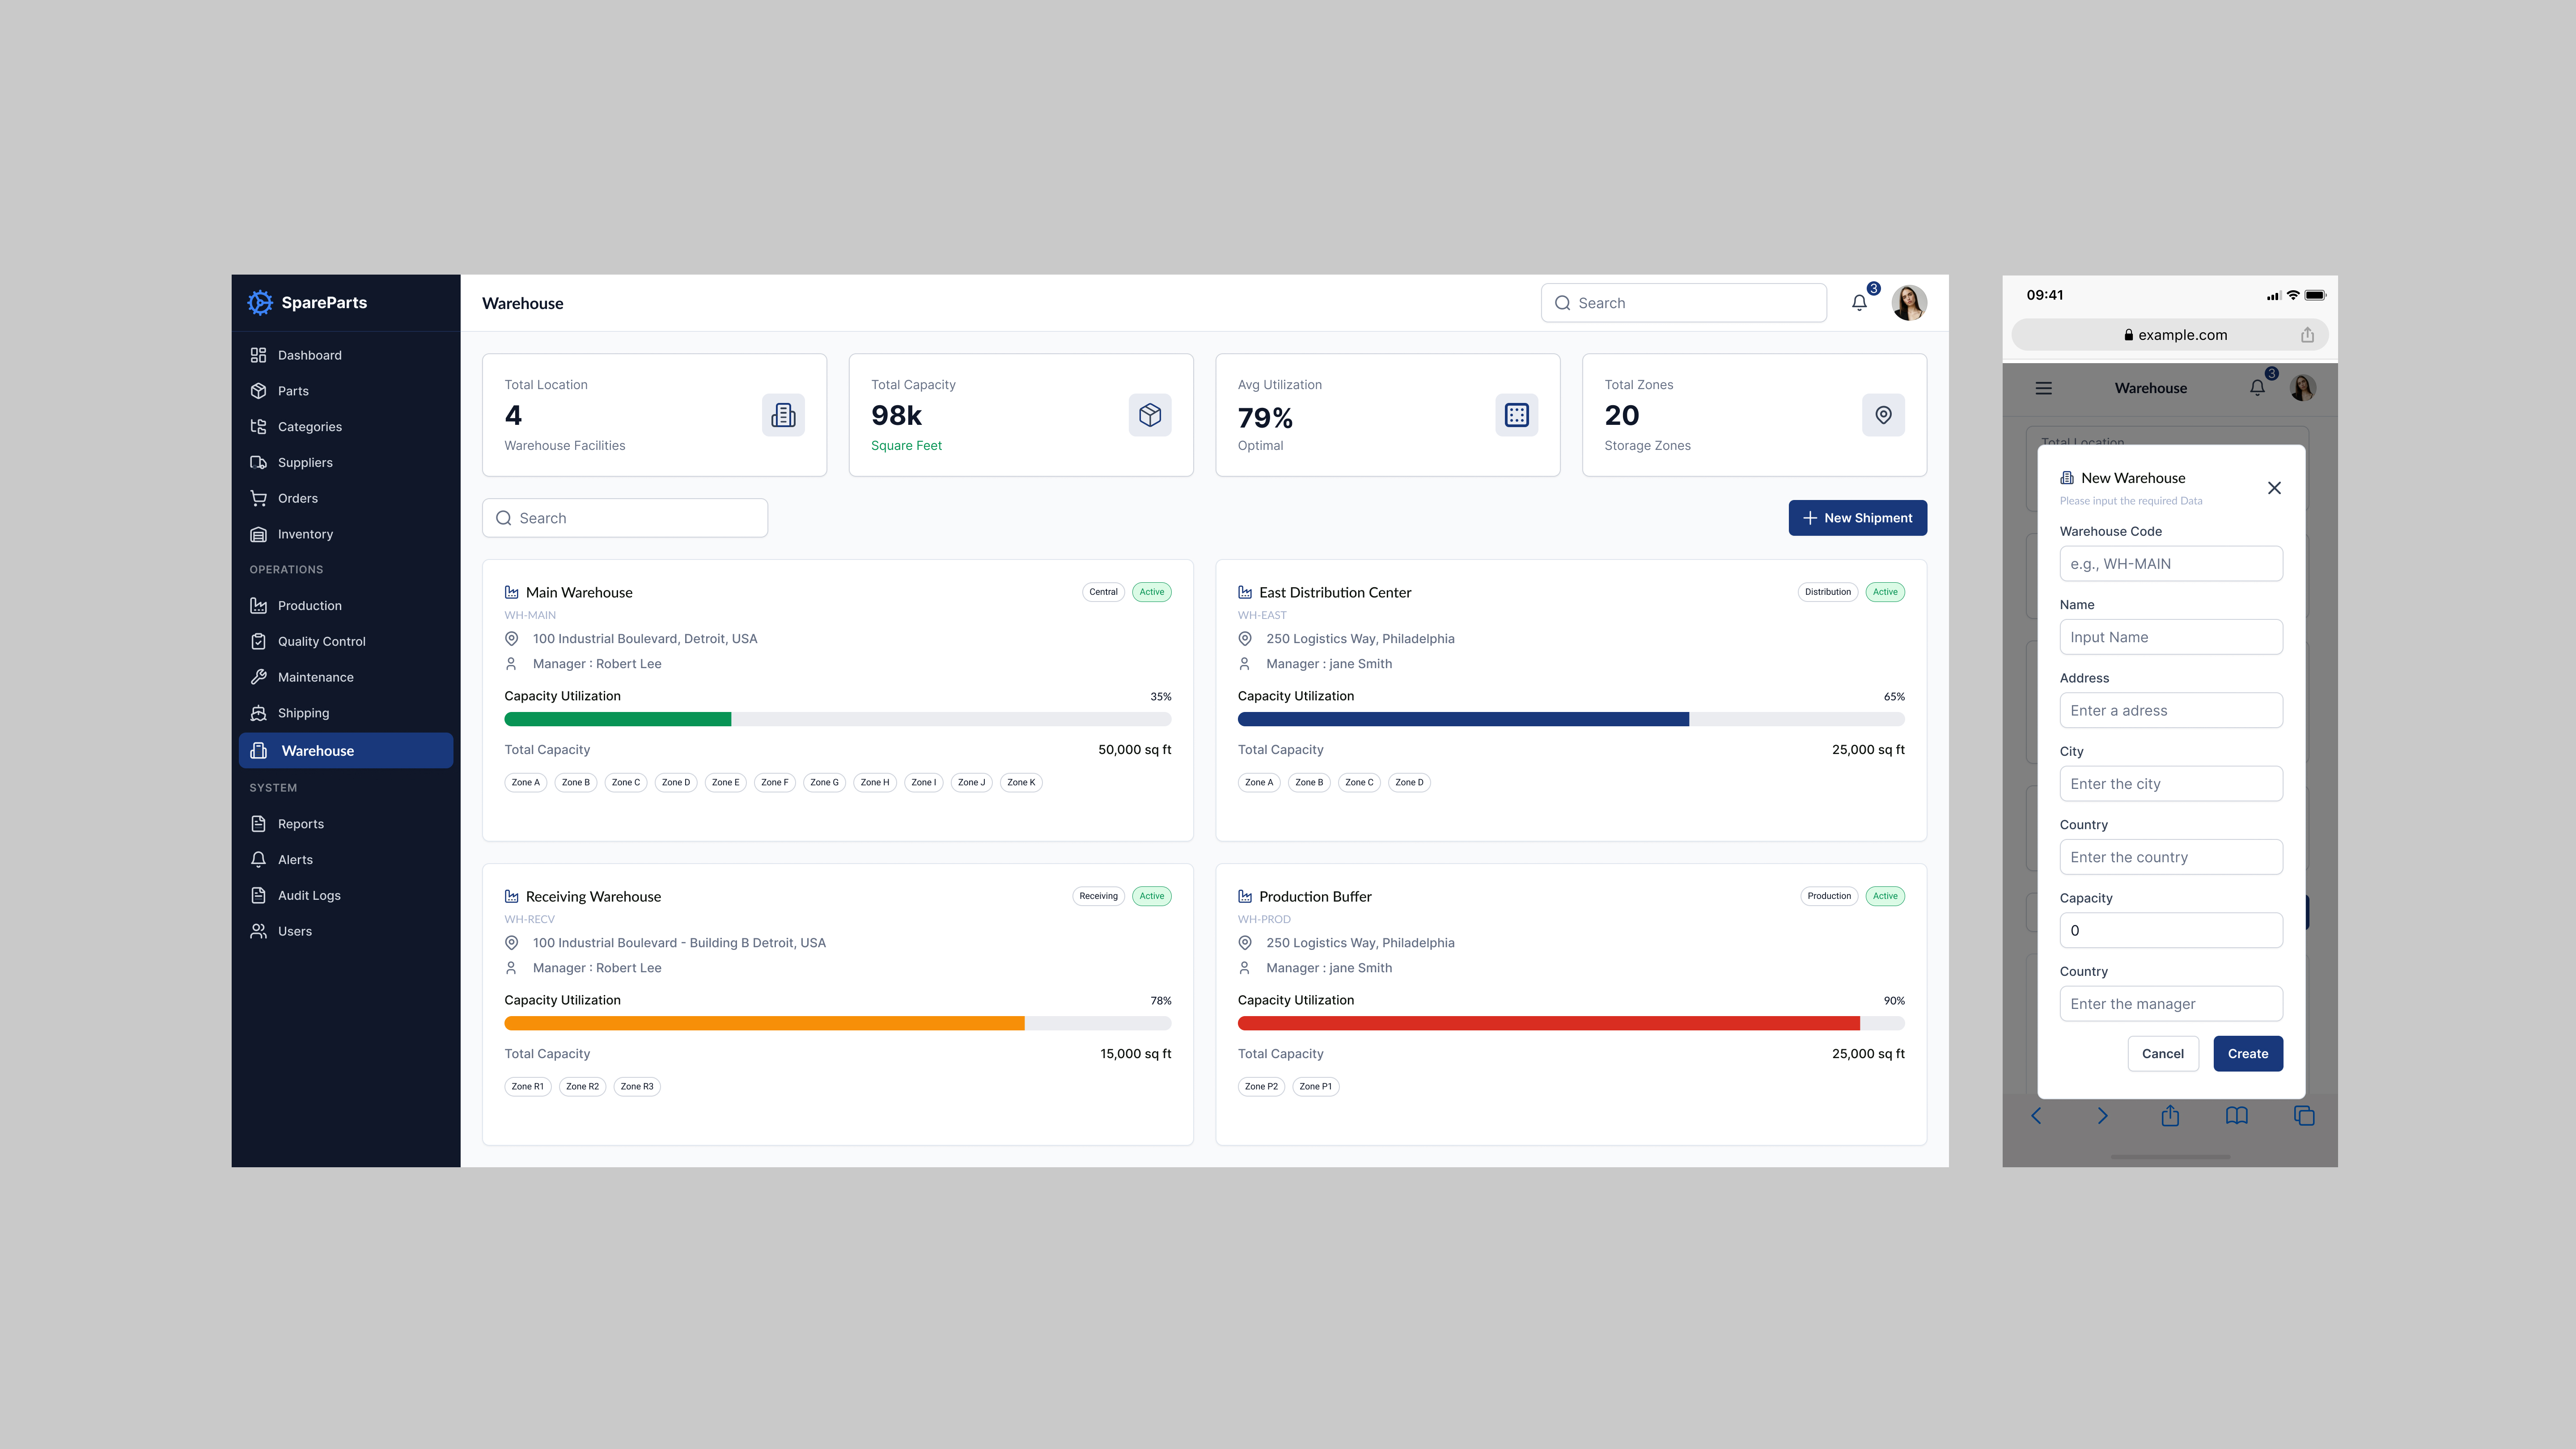
Warehouse Management

Warehouse Management

Multi-facility overview: locations, capacity utilization, storage zones, real-time capacity with progress bars.

SYSTEM & ADMINISTRATION

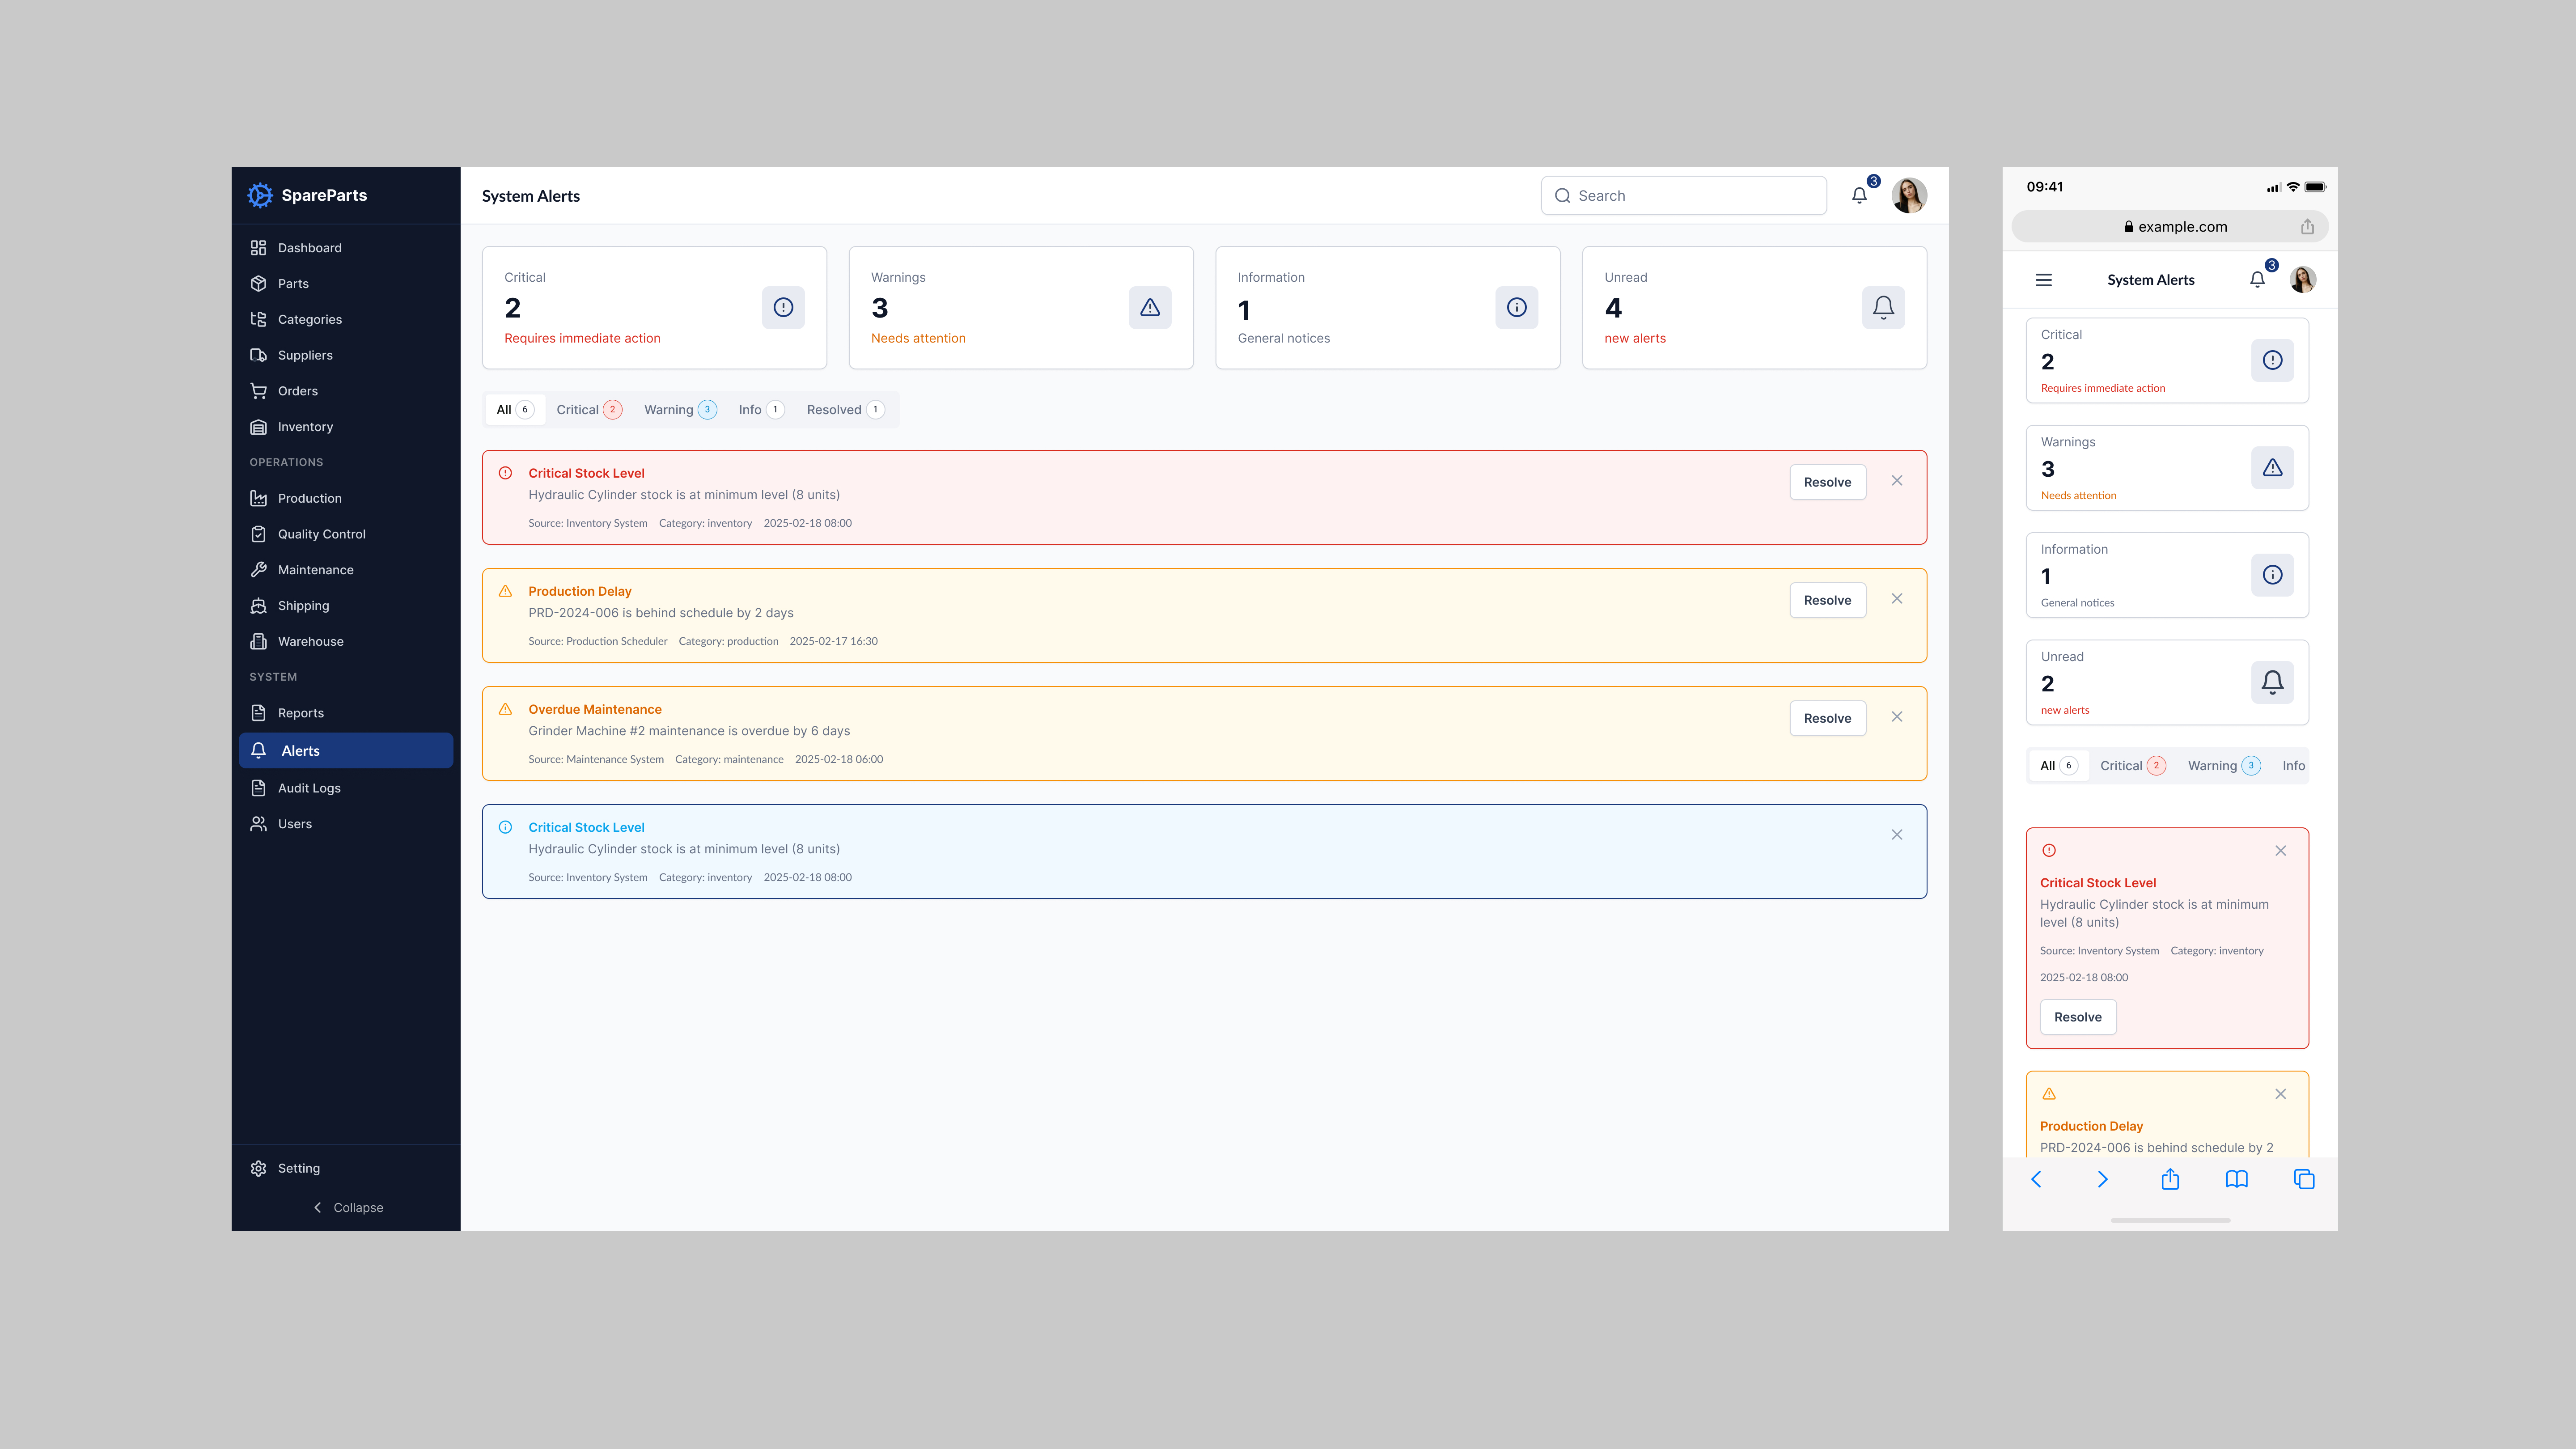
System Alerts

System Alerts

Priority-based alert system — Critical, Warnings, Information, Unread — color-coded with timestamps and quick resolve.

User Management

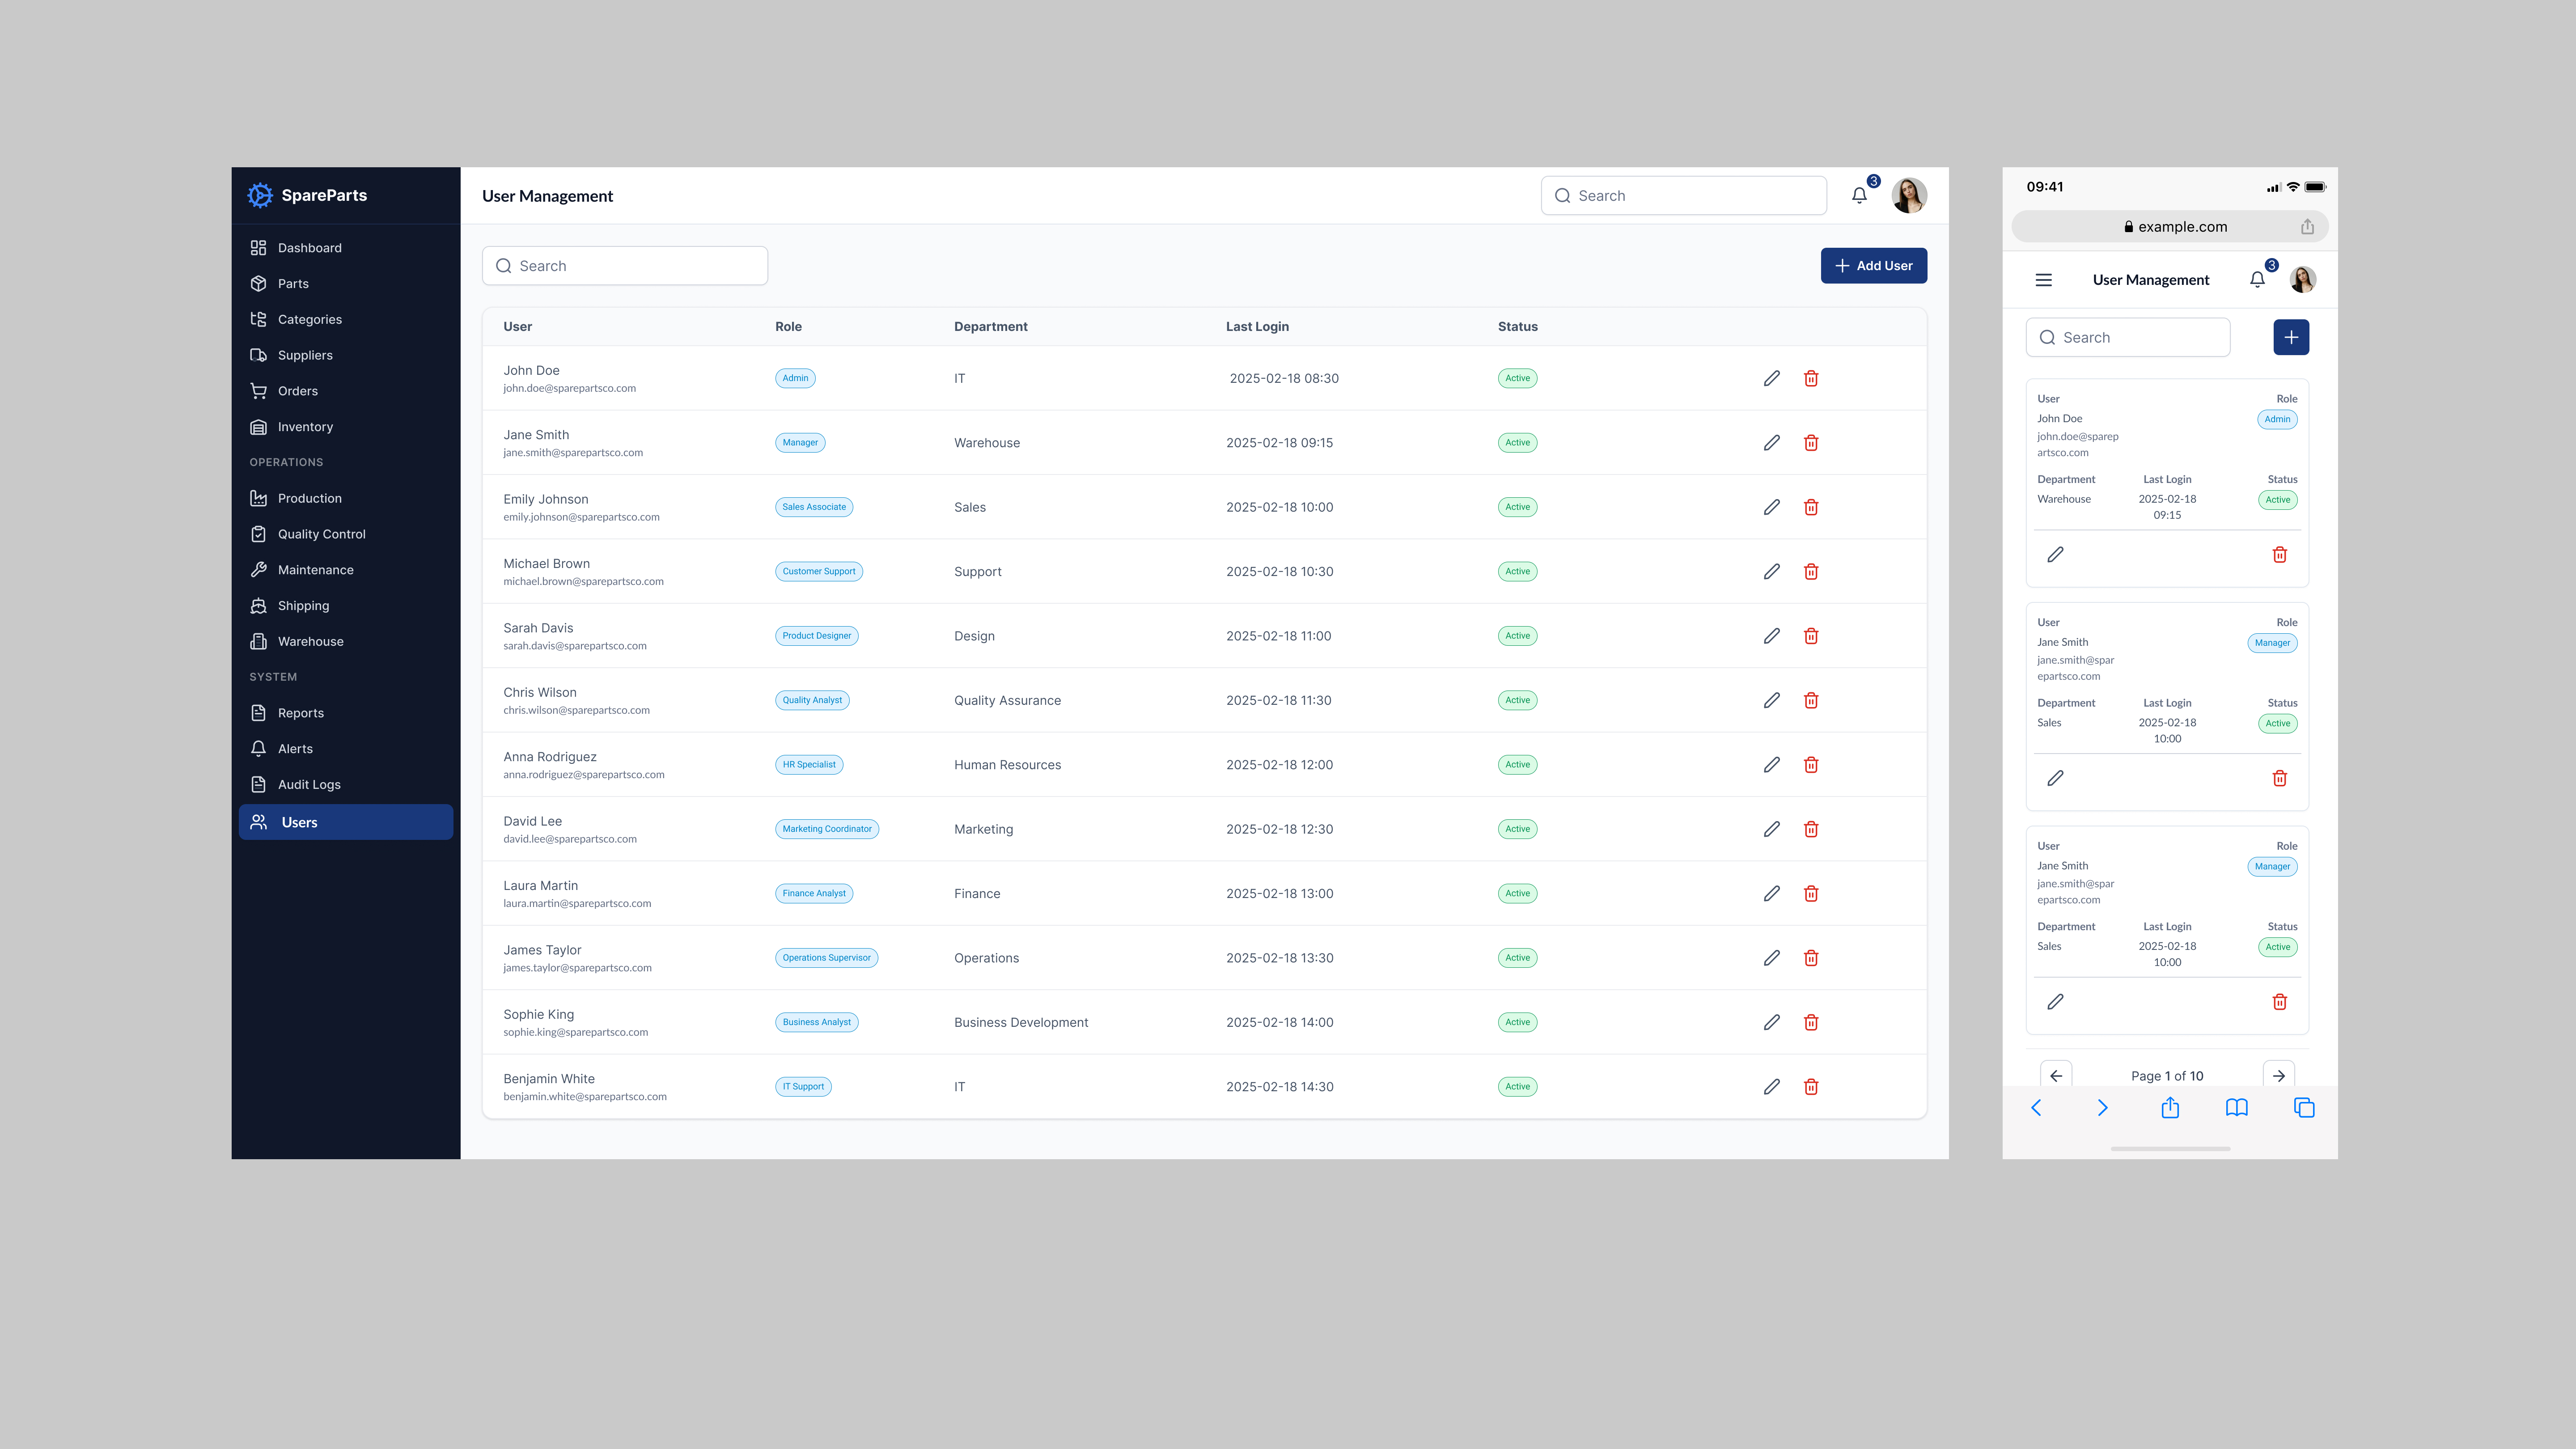
User Management

Role-based access control with user roles, departments, last login, and status — inline management actions.

TECHNICAL APPROACH

How I build dashboards developers love to implement

Component-Based Architecture

Every element — tables, cards, charts, alerts, status badges — is a reusable component with documented props and states. Developers mix and match to build new views without custom design work.

Design System Foundation

Built on a comprehensive system with 259 variables covering colors, spacing, typography, shadows, and breakpoints. Consistent spacing, predictable layouts, no guesswork during development.

Responsive Breakpoints

Defined at 1440px, 1024px, 768px, and 375px. At each breakpoint, layouts are specified exactly — not just "make it fit."

Developer-Friendly Specs

All measurements in 8px increments. Clear naming conventions. Hover, loading, error, and empty states all designed and documented.

Real Data Scenarios

Designed with realistic data volumes — not Lorem ipsum. Shows what happens with 10-character vs 50-character names, with 3 items vs 300 items.

DELIVERABLES

What I delivered

Complete Design System

✓ Color tokens with WCAG compliance

✓ Typography scales and spacing system

✓ 175+ reusable components

✓ Light and dark mode support

All Dashboard Screens

✓ Desktop designs (1440px+)

✓ Tablet layouts (768px–1024px)

✓ Mobile adaptive designs (375px+)

✓ All interactive states

Developer Documentation

✓ Component usage guidelines

✓ Responsive behavior specs

✓ Accessibility annotations

✓ Clean, organized Figma files

NEXT PROJECT

Bali Tour Booking App →

Streamlined discovery-to-booking experience for travelers